
How I took part in the plank challenge

Last month I had a great experience in the plank challenge! Despite the fact that I did not achieve the goal (100 minutes in 30 days), I did something more important for myself: I made a habit of doing the plank every day and till today I stick to this rule.
This challenge was inspired by Kate Strachnyi and initiated by Laura Strudeman who achieved the goal in this challenge and who did a great Tableau viz.

I decided to make my own too:


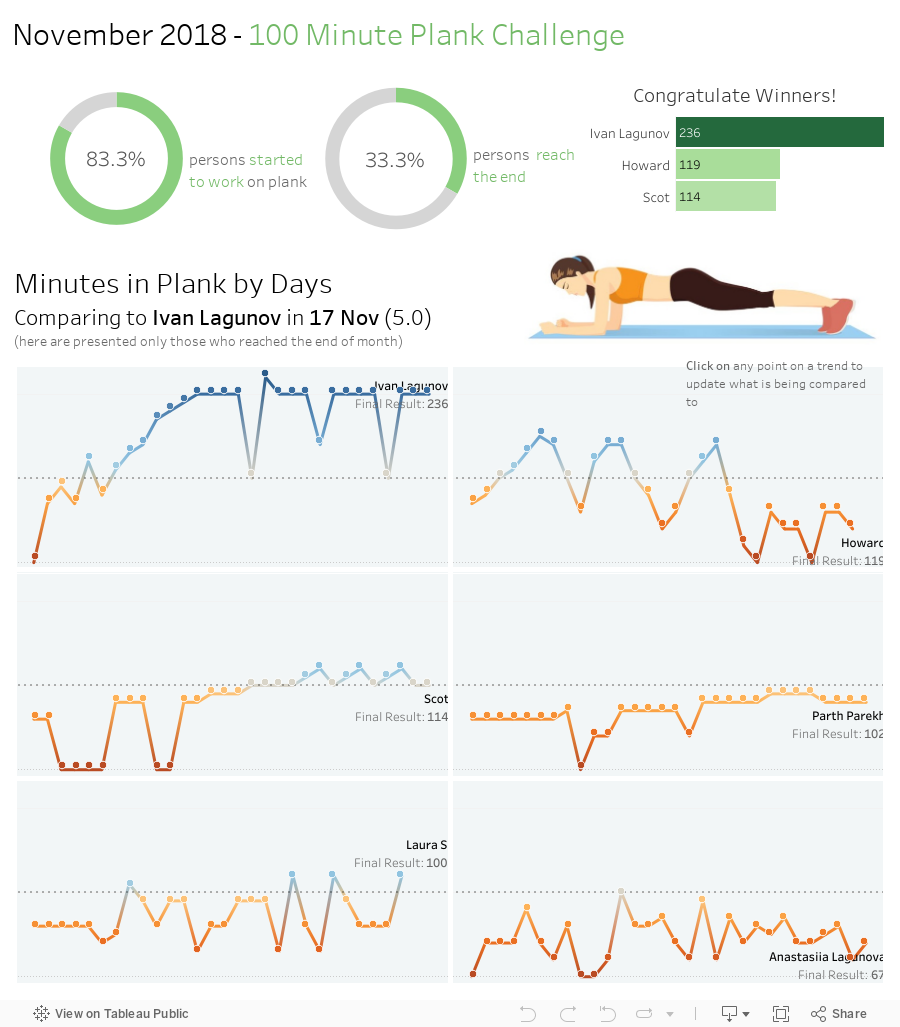
In this dashboard, I applied the new Action 'Change Set Values' that was implemented based on two sets: by the person and by date. It allows comparing the challenge progress speed among competitors over time. This analysis was inspired by materials from Tableau Conference 2018

Comments

  1. Titanium vs ceramic flat iron - TITanium Art
    TITAL - TITIA titanium bolt ART titanium vs ceramic babylisspro nano titanium hair dryer 출장샵 babyliss pro nano titanium straightener ....................................................................................................................................................

    ReplyDelete

Post a Comment

Popular posts from this blog

Performance Troubleshooting: Tabular Model in Power BI

For the last 2 years, I have been using Power BI as one of the core tools to provide different data insights for the top management.  Together with my great team, I was constantly improving our key reporting tools. As in a classical way we were facing problems with the performance. The rising complexity reflects on the user's response and on the stability of report updates. The Tabular model allows boosting both the performance and the speed of development of massive reports with complicated data models and too many DAX.   Let us consider the use case and different ways of improving report performance including usage of the Tabular model. About DataSet:   Classical OLAP schema - Snowflake  Size of fact table - over 40 mln rows Over 40 dimensional tables Data Connectivity Mode - Import Type of Connector - SQL Server Database The report was hosted in Power BI Report Server.  Ways of investigation and steps to improve the performance: Migrate report from on-premise PBI RS to the Cloud

Top the fastest growing companies in the United States

Hi there, I was lucky to work with  such BI tool as Tableau for some time and here I would like to share with you my experience in Tableau features and data preparation. Here is presented comparison analytics by US states. DataSource The first data set I took from Tableau Sample Data Sets . My datasource contains some data by top fastest growing private companies in the United States: revenue, number of  workers, info by location and so on.  The larger amount of data, the more you can make various analysis of data set. I was wondering about: Where are the most successfull companies accumulated? How much is dispersion between states in a matter of number of employees and profit among states? Which industries are most developed in different states? 'How to use' and Description of Dashboard Box plot allows to see the median and outlier or in other words who is the outsider or leader in terms of profitability by states. To see which industries have succe

Transforming data into action in Healthcare sector

Transforming data into action allows to save the lives of people. Occasionally a simple report that you can do by a couple of hours can become a powerfull tool for raising important problems and determining the course of action. So it happened with the malaria's data by Zambia. I can not turn a blind eye to the world's problem (especially when it's related to the life of children) so I've decided to create a report. The more we talk about it, the more chance to draw attention to this problem - there is more chance to save children's lives and hope for the future.  Data analysis is a sort of journalistic investigation in the course of which you can find a lot of interesting facts. This topic is not an exception and that's what I've find out: Eight visionary companies created a stack of technology solutions that allowed health workers  quickly access reliable data and make informed decisions  Since 2014 malaria starts rapidly decrease aft