Hi there,
I was lucky to work with such BI tool as Tableau for some time and here I would like to share with you my experience in Tableau features and data preparation.
Here is presented comparison analytics by US states.
DataSource
The first data set I took from Tableau Sample Data Sets. My datasource contains some data by top fastest growing private companies in the United States: revenue, number of workers, info by location and so on.
The larger amount of data, the more you can make various analysis of data set. I was wondering about:
Interesting Facts
I was lucky to work with such BI tool as Tableau for some time and here I would like to share with you my experience in Tableau features and data preparation.
Here is presented comparison analytics by US states.
DataSource
The first data set I took from Tableau Sample Data Sets. My datasource contains some data by top fastest growing private companies in the United States: revenue, number of workers, info by location and so on.
The larger amount of data, the more you can make various analysis of data set. I was wondering about:
- Where are the most successfull companies accumulated?
- How much is dispersion between states in a matter of number of employees and profit among states?
- Which industries are most developed in different states?
'How to use' and Description of Dashboard
- Box plot allows to see the median and outlier or in other words who is the outsider or leader in terms of profitability by states.
- To see which industries have succeded in any state, click by interested state in box plot and here you will find details by by industries.
- Play with filters which is in the right part of dashboard to figure out details by more specific data set.
- Filters in the right hand of dashboard allows to filter data and make it more specific.
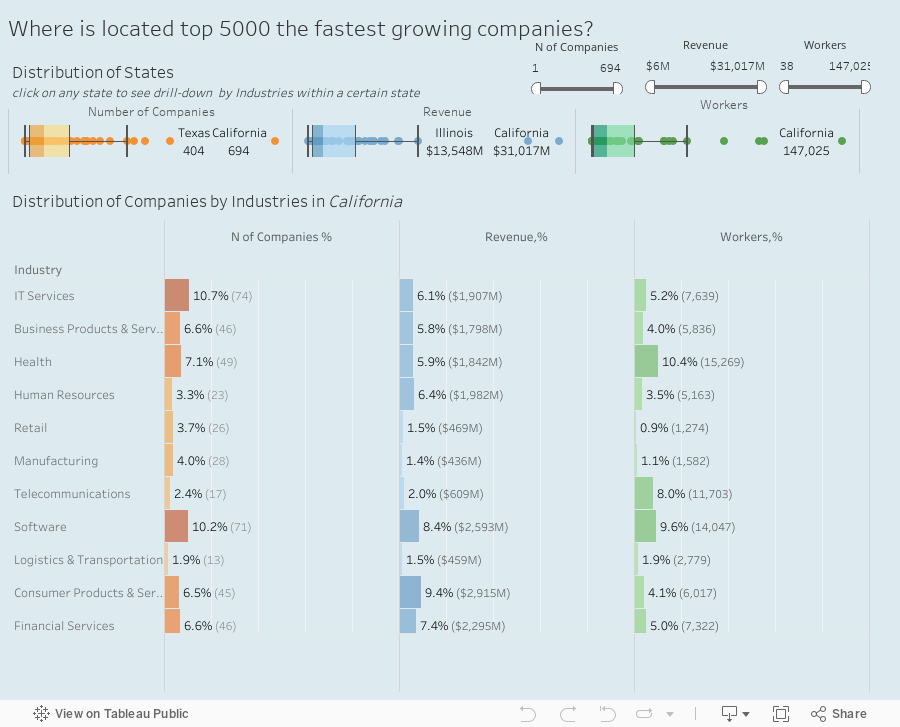
Interesting Facts
- California is the absolute leader in terms of number of companies, leaving far behind their competitors-states
- Despite that Illinois has the same level of labour force as Texas, the level of revenue is twice smaller
learn tableau online
ReplyDeleteYour blog is awfully appealing. I am contented with your post. I regularly read your blog and its very helpful. If you are looking for the best alteryx, then visit Analytics Fun. Thanks! I enjoyed this blog post.
ReplyDeleteGreat Article. Thank you for providing such a unique and valuable information to your readers. I really appreciate your work. Philippines Export Data
ReplyDeletekayseriescortu.com - alacam.org - xescortun.com
ReplyDeleteperde modelleri
ReplyDeletesms onay
mobil ödeme bozdurma
nft nasıl alınır
Ankara Evden Eve Nakliyat
trafik sigortasi
dedektor
Kurma Website
aşk kitapları
maltepe mitsubishi klima servisi
ReplyDeletekadıköy mitsubishi klima servisi
kartal bosch klima servisi
beykoz samsung klima servisi
beykoz mitsubishi klima servisi
üsküdar mitsubishi klima servisi
pendik vestel klima servisi
pendik bosch klima servisi
beykoz lg klima servisi
Comparta gran información sobre su blog, Blog realmente útil para nosotros. Comprar Dutasterida
ReplyDelete*TradeImeX* Info Solution Pvt. Ltd. delivers the most accurate and authentic Vietnam Trade Data to its clients which is stacked with pretty much everything that is capable to help advertisers and dealers to figure out their techniques in an extremely vital and orderly way. We likewise give tweaked Vietnam Import Data And Vietnam export data
ReplyDeletereports to those clients who need to-the-point data for a superior comprehension of the ongoing situation in a specific country. Get in touch with us now for more assistance and help.
كانت السقالات المعدنية تُعد طريقة آمنة وكفؤة للعمل على ارتفاعات عالية وتمكنت من تحقيق التوازن والثبات اللازمين للعمال كذلك قد تتمتع سقالات معدنية للبيع في مصر في المستقبل بأنظمة تحكم ذكية وتقنيات الاتصالات لتحسين التنسيق بين العمال وتتبع تقدم العمل.
ReplyDeleteينصح الدكتور محمود ناصر احسن دكتور قدم سكري مرضي الدوالي بضرورة ارتداء الجوارب المضغوطة أو الضاغطة يمكن أن يساعد على ضغط الشعيرات الدموية وتحسين تدفق الدم.
ReplyDeleteالمواسير PVC و UPVC هما نوعان من الموواسير البلاستيكية، وهما يختلفان في بعض النقاط الرئيسية:
ReplyDelete1. المواد: المواسير PVC مصنوعة من بولي فينيل كلوريد، في حين أن المواسير UPVC مصنوعة من البولي فينيل كلوريد غير المصنّر.
2. المتانة: المواسير UPVC أكثر متانة وصلابة من المواسير PVC، وهذا يجعلها أكثر تحملًا لظروف الاستخدام القاسية.
3. مقاومة الحرارة:ppr pipes in Egypt تتحمل درجات الحرارة العالية بشكل أفضل من المواسير PVC.